A real divergence between the Fed's two inflation gauges is the defining feature of the current data — and what the platform's evidence can and cannot yet say about it
The United States dataset — 52 canonical series spanning growth, inflation, labor, credit, and fiscal position — currently tells two different stories about inflation at once. Core PCE, the Federal Reserve's own preferred gauge, has climbed steadily since November 2025, from 2.83% year-over-year to 3.41% in May 2026. Core CPI, computed from the platform's canonical index levels, has moved differently over the same window — not on a clean downward path, but choppy and range-bound, dipping to 2.47% in February before rising back to 2.82% in May and easing again to 2.57% in June. The gap between the two measures, in the same month of May, stands at 59 basis points — the widest point in the trailing eighteen months of data. That divergence, sustained for roughly seven months now rather than a recent blip, is the central finding of this piece.
Every figure in this piece is drawn from the platform's own canonical data, sourced in turn from primary institutional releases: the Bureau of Economic Analysis (GDP, trade, current account), the Bureau of Labor Statistics (CPI, unemployment, payrolls, wages), the Federal Reserve (policy rate, money supply, industrial production, inflation expectations), and the OECD (composite leading indicator). One data-quality issue surfaced during fact-checking and is disclosed here rather than worked around silently: the platform's headline CPI series currently combines three sources reporting in three incompatible units without reconciliation, producing an unreliable canonical value. Headline CPI is excluded from this piece entirely; core CPI, which is single-sourced and internally consistent, is used throughout instead.
Core CPI vs. Core PCE, Year-over-Year
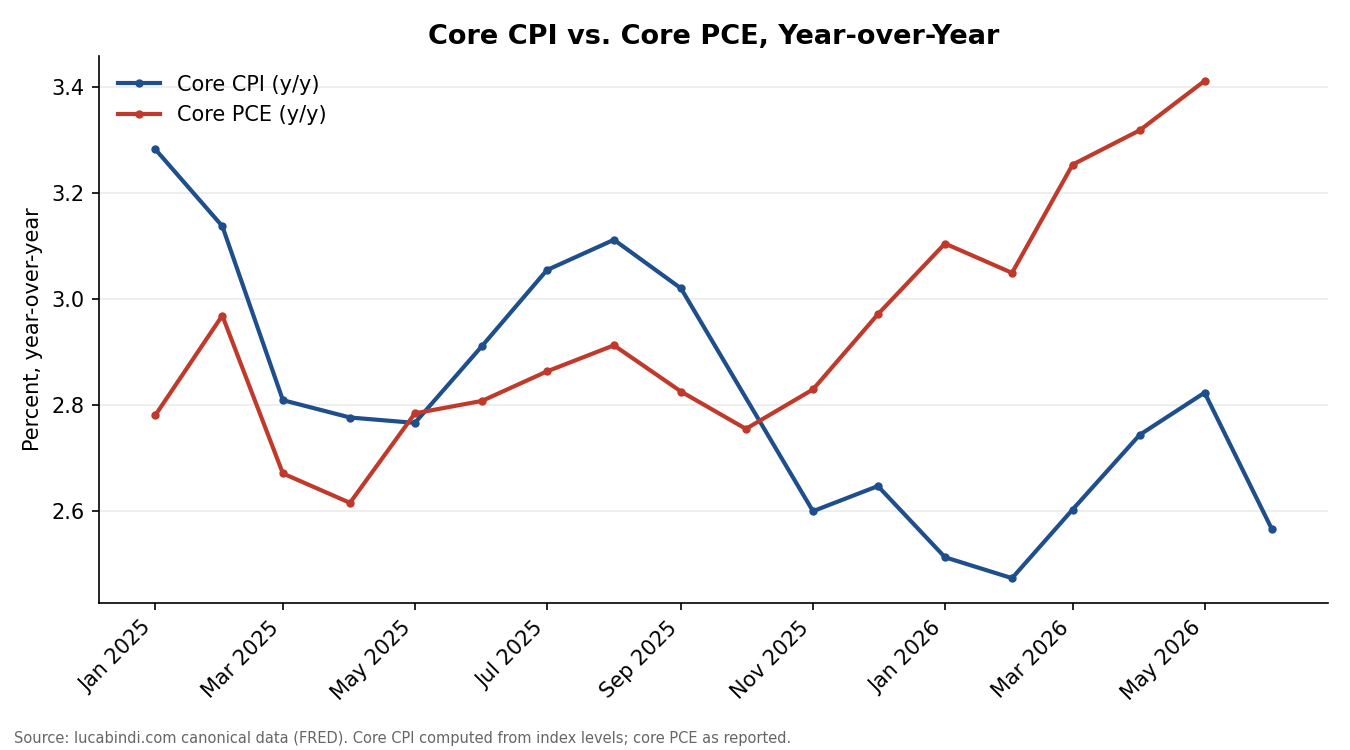
The most plausible explanation for the PCE/CPI gap remains compositional rather than a sign of broad-based reacceleration — the two indices weight household spending categories differently, and such gaps have narrowed again after past episodes of temporary widening. But this divergence has now persisted for roughly seven months, considerably longer than a brief, noise-driven gap would typically last, and that duration is itself evidence worth weighing against the "temporary" framing rather than folding into it uncritically.
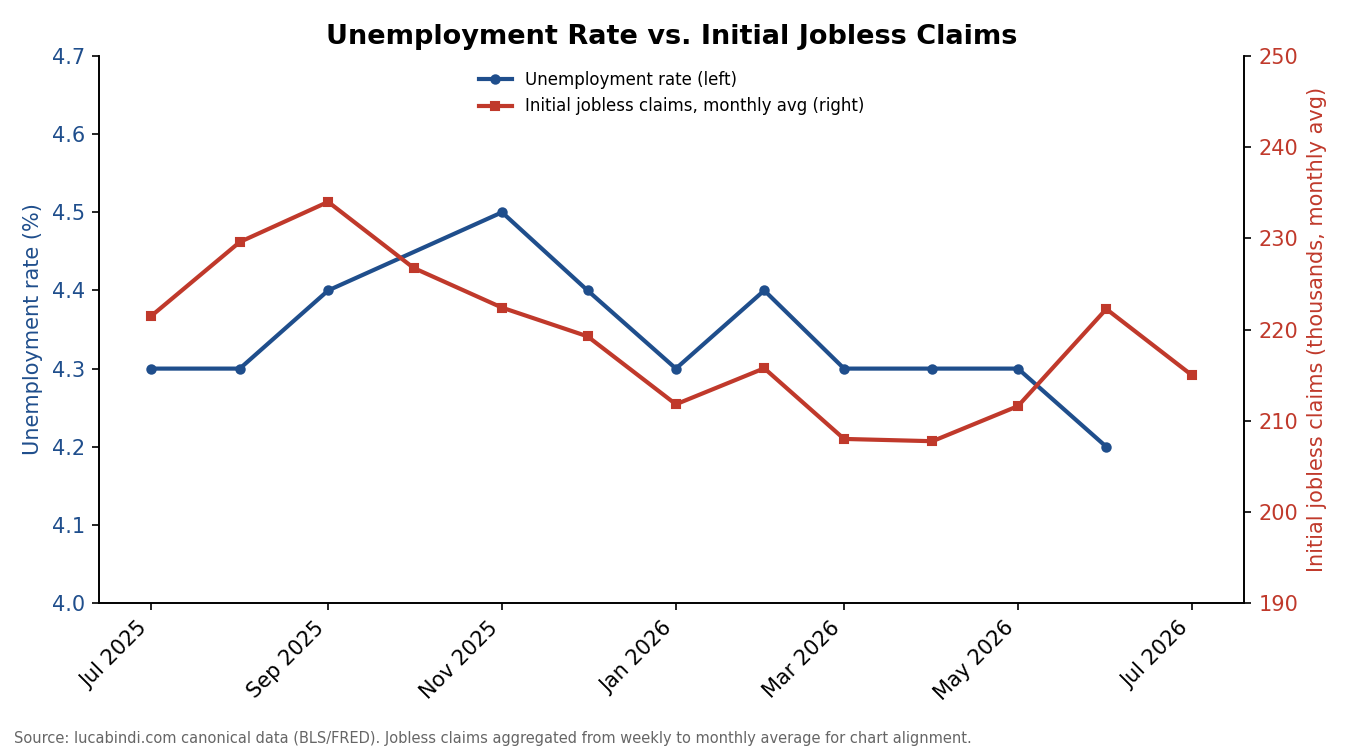
The labor market data points toward improvement from a November 2025 peak rather than either continued strength or emerging weakness. Unemployment fell from 4.5% in November to 4.2% in June, and initial jobless claims eased from an autumn average near 230,000 per month to the low 200,000s by spring, before a modest tick back up into early summer.
Unemployment Rate vs. Initial Jobless Claims
This content is for informational purposes only and is not investment, legal, or tax advice. See the full Disclaimer.
The highest inflation in this programme, solid governance, and the most severe data gap found in this entire research effort
US growth has outpaced Germany, France, Japan, and the UK for five consecutive quarters -- and long-end bond yields don't track the divergence at all
The Fed's balance sheet has flattened over the past six weeks after three years of runoff, while the ECB's keeps contracting -- launch edition of a new recurring Report
The largest risk to this piece's reading is that the divergence is not compositional at all — if the next two PCE prints confirm rather than reverse the recent acceleration, the "orderly deceleration" framing above would need real revision, not a footnote.
Base case. The PCE/CPI divergence continues for at least another quarter before beginning to narrow; the labor market continues its recent improvement; the Federal Reserve holds its current stance pending clearer resolution.
Upside. Core inflation genuinely continues cooling toward target, with the CPI reading proving the more accurate leading signal.
Downside. Labor market conditions deteriorate faster than current data suggests, independent of which inflation reading proves correct.
The available evidence does not yet distinguish decisively between the scenarios above. The one implication that does follow directly from the evidence is procedural: given the Federal Reserve's own stated preference for the PCE measure, the next PCE print is likely to carry more weight for the policy path than the next CPI print.
Core PCE and core CPI next releases; headline CPI canonical data quality (flagged for future ETL review); US Treasury source health; wage growth relative to both inflation readings.
 lucabindi.com