Fifty years of external accumulation, the valuation mechanism and the question of whether net international investment positions could transmit the next repricing of currencies and financial assets
At the end of June 2026 the United States owed the rest of the world a net $22.42 trillion (BEA), against net external assets of $4.07 trillion in China, ¥561.75 trillion in Japan, €3.66 trillion in Germany and large positions in Norway, Switzerland, Singapore and the Netherlands. These stocks are the accumulated counterpart of differences between national saving and investment, but since the 2000s they have been moved increasingly by prices: in Q2 2026 the US position worsened by $1.15 trillion, of which transactions explain about $0.37 trillion. The thesis is that the next adjustment of global imbalances is more likely to be financial than commercial, working through exchange rates, relative asset prices and the return differential on gross positions. The evidence supports valuation as a first-order driver; it supports the resilience conferred by US dollar liabilities and equity-heavy foreign claims, subject to investor confidence; it only partly supports a Japanese repatriation channel; and it does not show a disorderly adjustment under way. Official figures are heavily revised: the US end-2025 NIIP moved from −$27.54 tn to −$21.87 tn on a methodology change, and the UK end-2025 figure across three vintages.
At the end of June 2026 the United States owed the rest of the world a net $22.42 trillion (BEA). Against that stood net external assets of $4.07 trillion in China (end-2025, SAFE), ¥561.75 trillion in Japan (Ministry of Finance, about $3.5 trillion), €3.66 trillion or 81% of GDP in Germany (Bundesbank), NOK 21.3 trillion in Norway (Statistics Norway), CHF 966 billion in Switzerland (SNB) and S$1.39 trillion in Singapore (SingStat), together with a large position in the Netherlands. These stocks are the accumulated counterpart of decades of differences between national saving and domestic investment. But since the 2000s they have been moved increasingly by prices rather than by trade: in the second quarter of 2026 the US position worsened by $1.15 trillion, of which net financial-account transactions explain about $0.37 trillion.
Our thesis is that the next large adjustment of global imbalances is more likely to be financial than commercial. It would work through exchange rates, relative equity and bond prices and the returns earned on gross positions, which move the net position without any change in trade flows. That makes the external balance sheet a possible transmission mechanism for a repricing of currencies and assets, but only under three conditions that the data let us test separately: a change in the relative return on assets owned abroad and liabilities owed to foreigners, a change in the currency composition that turns valuation from a cushion into a drain, and a change in the behaviour of the marginal foreign investor. We do not assume that a disorderly adjustment is inevitable, and several features of the largest debtor, the United States, argue against it.
A caution runs through the paper: official NIIP figures are revised heavily. BEA’s annual update of 24 June 2026 lowered the end-2025 US net liability from $27.54 trillion (about 90% of GDP) to $21.87 trillion (71.6%) through a change in how foreign direct investment is valued; it was a statistical revision, not an economic event. The ONS estimate of the UK’s end-2025 net liability moved from £199.8 billion to £105.6 billion and then to £60.7 billion across three vintages. Comparisons that mix vintages or reporting dates can reverse a conclusion, so reporting dates are shown throughout.
This content is for informational purposes only and is not investment, legal, or tax advice. See the full Disclaimer.
Graded against the evidence, the claim that valuation is a first-order driver of NIIP changes is supported; the claim that currency composition makes the US position more resilient than the headline suggests is supported by IMF and BEA data but depends on investor confidence; the claim that Japanese repatriation could reprice global duration is partly supported, because Japan holds the assets and domestic yields have risen, but Japanese net sales of foreign debt in 2026 (¥4.16 trillion to October, Ministry of Finance data as reported by Reuters) are small relative to portfolio assets of ¥768.7 trillion; and the claim that a disorderly external adjustment is under way is not supported.
The net international investment position is the difference between the financial assets that residents of an economy own abroad and the financial liabilities they owe to non-residents. A positive NIIP identifies a net external creditor; a negative one, a net debtor. It is a stock, recorded at a date and in a currency, and it changes through three channels:
NIIP(t) = NIIP(t−1) + financial-account transactions + price and exchange-rate valuation changes + other volume changes
Over long periods the transactions term mirrors the current account, which equals national saving minus domestic investment. That is the macroeconomic root of creditor and debtor status, but the identity does not say why saving and investment differ: fiscal policy, demographics, institutional saving, income distribution, industrial structure and the international monetary system all enter. Over shorter periods the valuation term can dominate.
Five distinctions are easy to blur and are kept apart here. The NIIP is not national wealth: it excludes domestic real estate, infrastructure, productive capital and claims between residents. It is not sovereign debt: Japan combines a general-government debt ratio above 200% of GDP with a net external creditor position, and Italy, with a debt ratio near 140%, is a net external creditor, because the government’s liabilities are largely to residents and the private sector owns assets abroad. It is not the current account, which is the annual flow. It is not external debt, which covers only debt instruments and excludes equity and direct investment. And net external assets are not official reserves: China’s reserves are 32% of its gross external assets but 92% of its net position.
Gross positions matter as much as the net. The euro area’s NIIP is 11.0% of GDP, but its gross assets are 257% and gross liabilities 246% of GDP; the UK’s net position is close to balance on IMF data while gross assets and liabilities are each close to 490% of GDP. Two economies with the same net position can face very different exposure to price, currency and liquidity shocks, so the analysis below is made in gross terms wherever the data allow.
Table 1 — Latest official NIIP positions (national and regional sources)
| Economy | Reporting date and currency | External assets | External liabilities | NIIP | Status |
|---|---|---|---|---|---|
| United States | End-Q2 2026, US$ | $46.97 tn | $69.39 tn | −$22.42 tn | Preliminary; new FDI methodology (June 2026) |
| China | End-2025, US$ | $11.786 tn | $7.715 tn | +$4.071 tn | Final (SAFE) |
| Japan | End-2025, yen | ¥1,805.6 tn | ¥1,243.9 tn | +¥561.75 tn | Final (MoF); +4.4% year on year |
| Germany | End-2025, euro | — | — | +€3,661 bn (81% of GDP) | Bundesbank; up €212 bn on the year |
| United Kingdom | End-2025, sterling | about £15 tn | about £15 tn | −£60.7 bn (2.0% of GDP) | Pink Book 2026 |
| Euro area | End-2025, euro | — | — | +€1.76 tn (11.0% of GDP) | ECB, first estimate |
| Spain | End-Q4 2025, euro | — | — | −€755.3 bn (−44.8% of GDP) | Banco de Espana |
| Netherlands | End-Q3 2025, euro | €10,374 bn | €9,806 bn | +€568 bn | DNB (24 December 2025); 51.4% of GDP at mid-2025 (Eurostat) |
| Switzerland | End-2025 / Q2 2026, franc | CHF 5,341 bn / 5,564 bn | CHF 4,375 bn / 4,578 bn | +CHF 966 bn / +CHF 986 bn | SNB; Q2 2026 is the latest |
| Singapore | End-2025 / Q2 2026, S$ | S$8,830 bn / 9,438 bn | S$7,441 bn / 7,861 bn | +S$1,389 bn / +S$1,577 bn | SingStat |
| Norway | End-2025 / Q2 2026, krone | — | — | +NOK 21,279 bn / +NOK 22,825 bn | Statistics Norway; GPFG NOK 21,268 bn at end-2025 |
| Canada | End-Q2 2026, Canadian dollar | — | — | +C$1.95 tn | Statistics Canada (10 September 2026); 55.5% of GDP on the IMF 2025 basis |
| France | End-2025, euro | — | — | −€885.4 bn (−29.6% of GDP) | Banque de France; end-2024: −€704.0 bn |
| Belgium | End-Q2 2024, euro | — | — | +€375 bn (63% of GDP) | National Bank of Belgium; 52.1% of GDP on the IMF 2025 basis |
| Italy | End-2025 / end-Q2 2026, euro | — | — | +€348 bn (15.4% of GDP) / +€335 bn (14.6%) | Banca d’Italia |
| Australia | End-2025 / end-Q2 2026, Australian dollar | — | — | −A$638.5 bn / −A$638.9 bn | ABS; −22.4% of GDP on the IMF 2025 basis |
Table 2 — NIIP and gross external positions, 2025 (% of GDP)
| Economy | NIIP | Gross assets | Gross liabilities | Current account, 2025 |
|---|---|---|---|---|
| Japan | 86 | 272 | 187 | +4.9 |
| Germany | 85 | 335 | 250 | +4.5 |
| Canada | 55.5 | 351.6 | 296.0 | −0.9 |
| Belgium | 52.1 | — | — | −1.9 |
| Korea | 47.3 ($886 bn) | 153.2 | 105.9 | +6.6 |
| Italy | 15.4 | 193.5 | 178.0 | +1.1 |
| China | 20.7 | 60.1 | 39.3 | +3.8 |
| Euro area | 11.0 | 256.8 | 245.7 | +1.7 |
| India | −6.7 | 30.9 | 37.6 | −0.9 |
| Australia | −22.4 | 159.7 | 182.1 | −2.6 |
| France | −28.4 | 384 | 412 | −0.3 |
| Brazil | −49.4 | 47.1 | 96.5 | −2.9 |
| United Kingdom | −6.6 | 486 | 493 | — |
Three features stand out. The distribution is concentrated: the IMF’s policy paper Understanding Global Imbalances (IMF Policy Paper 2026/006, Executive Board discussion of 1 April 2026) finds that the United States, China, Germany and Japan account for roughly two-thirds of global imbalances, and puts net foreign assets at 3–3.5% of global GDP in 2024 for each of China, Germany and Japan. The ranking of creditors has changed: at end-2025, on the Ministry of Finance’s yen-converted comparison, Germany ranked first (¥675.5 trillion), China second (¥636.3 trillion) and Japan third, so Japan, the largest creditor until 2023, has been overtaken as its liabilities grew faster than its assets. And the composition varies widely: China’s liabilities are 52% direct investment and its assets 32% reserves, Japan’s assets are 43% portfolio investment and 21% direct investment, and Switzerland’s net position is dominated by currency reserves and direct investment abroad.
Table 3 — Phases of global external accumulation
| Phase | What changed | Verified anchor |
|---|---|---|
| 1970s | End of Bretton Woods, oil shocks, recycling of oil surpluses; external positions driven by trade and official flows, with small gross stocks | Qualitative |
| 1980s | Large US external deficits against Japanese and German surpluses; the 1985 Plaza Accord; on the current BEA series the US NIIP turned negative in 1989 | BEA/FRED: +10.4% of GDP in 1980, +2.4% in 1985, −2.5% in 1990 |
| 1990s | Financial liberalisation, European monetary integration, Asian crisis and the case for reserve accumulation; gross positions expand | Qualitative |
| 2000s | China joins the WTO in 2001; Asian and oil-exporter surpluses recycled into US assets; US deficit near 6% of GDP in 2006 | China’s NIIP peaked at 29.9% of GDP in 2008 (IMF) |
| 2008–12 | Global financial crisis and euro-area sovereign crisis; fragmentation of intra-euro flows; gross banking positions contract | Greece’s NIIP is still −139% of GDP and Ireland’s −54% (Eurostat, June 2025) |
| 2013–19 | Low rates, quantitative easing and negative yields; creditor positions of the euro area rebuild; current-account surpluses concentrate in Germany and the Netherlands | Dutch NIIP peaked at 89.6% of GDP in December 2020 (Eurostat) |
| 2020–26 | Pandemic, inflation, tightening, geopolitical fragmentation; valuation effects dominate; the euro-area NIIP turns positive in 2022 | US NIIP (BEA revised): −$15.4 tn (2021), −$14.2 tn (2022), −$17.1 tn (2023), −$22.1 tn (2024), −$21.9 tn (2025), −$22.4 tn (Q2 2026) |
The earlier phases were, above all, trade-driven. The United States moved from a position close to balance to a persistent debtor in the 1980s, Japan and Germany accumulated surpluses, and in the 2000s China added a third large creditor, with the accumulation concentrated in official reserves. In the decades after the early 1990s, gross positions grew much faster than output, which gradually changed what moves the net position. The change is visible in the most recent data. The US revised series shows the net liability widening by about $8 trillion between 2022 and 2024, a period in which the US current-account deficit was roughly 3–4% of GDP a year, or about $1 trillion; the difference is mostly valuation, driven by the outperformance of US equities and the strength of the dollar.
Three data points show how far a path can differ from the cumulated current account. China’s NIIP rose from 12.0% of GDP in 2021 to 20.7% in 2025, in line with its surpluses, but remains well below the 29.9% of 2008; its net assets rose by about $775 billion in 2025 (SAFE) while reserves recovered by about $290 billion, mostly through valuation. Japan’s net position reached 86% of GDP, from a pre-pandemic average of 59%, because of net direct-investment outflows and the yen’s depreciation. Korea’s NIIP fell sharply in 2025 to $886 billion (47.3% of GDP) despite a current-account surplus of 6.6% of GDP, because higher Korean equity prices raised the value of foreign-owned domestic assets. In each case the current account says where the economy is saving; the valuation term says what the claims are worth.
Figures 1 and 2 show the NIIP as a percentage of GDP from 1970 (or the first year available) to 2024 for the seven largest economies in the comparison, on the series and methodology described in their notes.
Figure 1 — Net external creditors: NIIP as % of GDP, 1970–2024
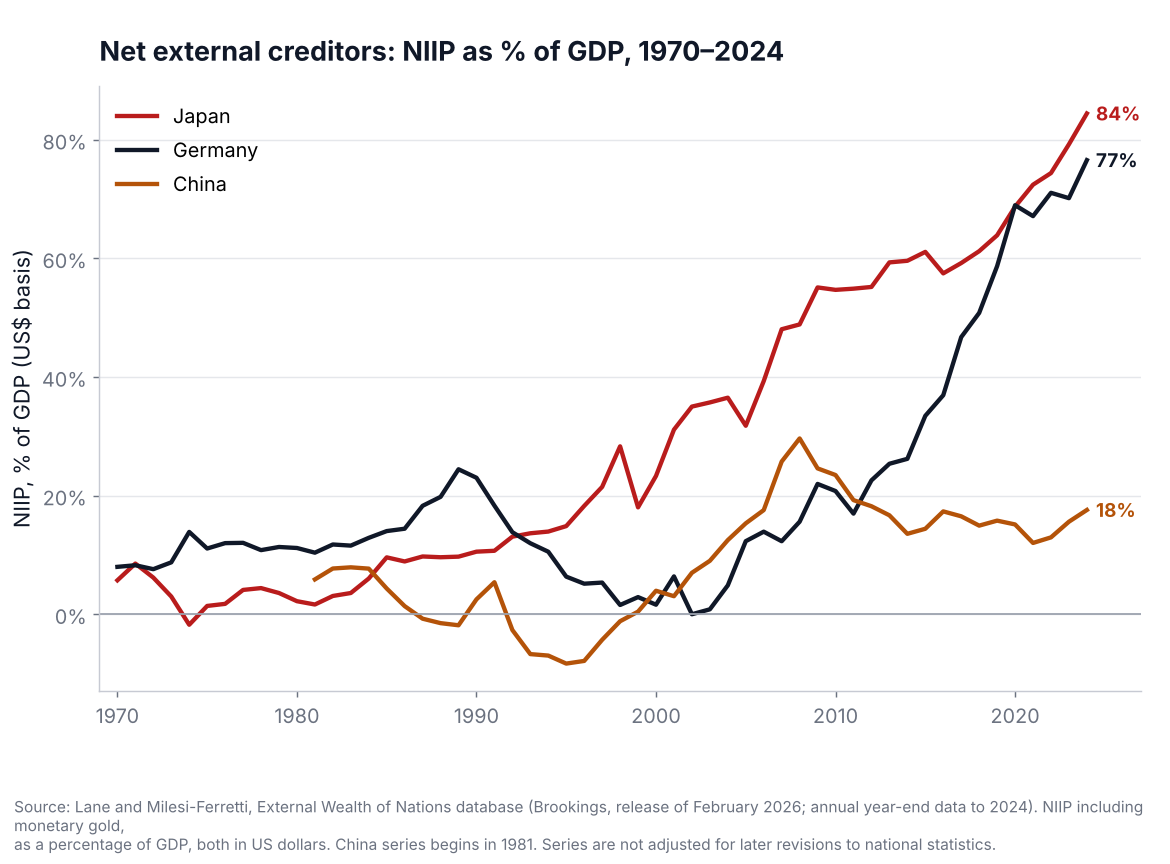
Figure 2 — United States, France, Italy and United Kingdom: NIIP as % of GDP
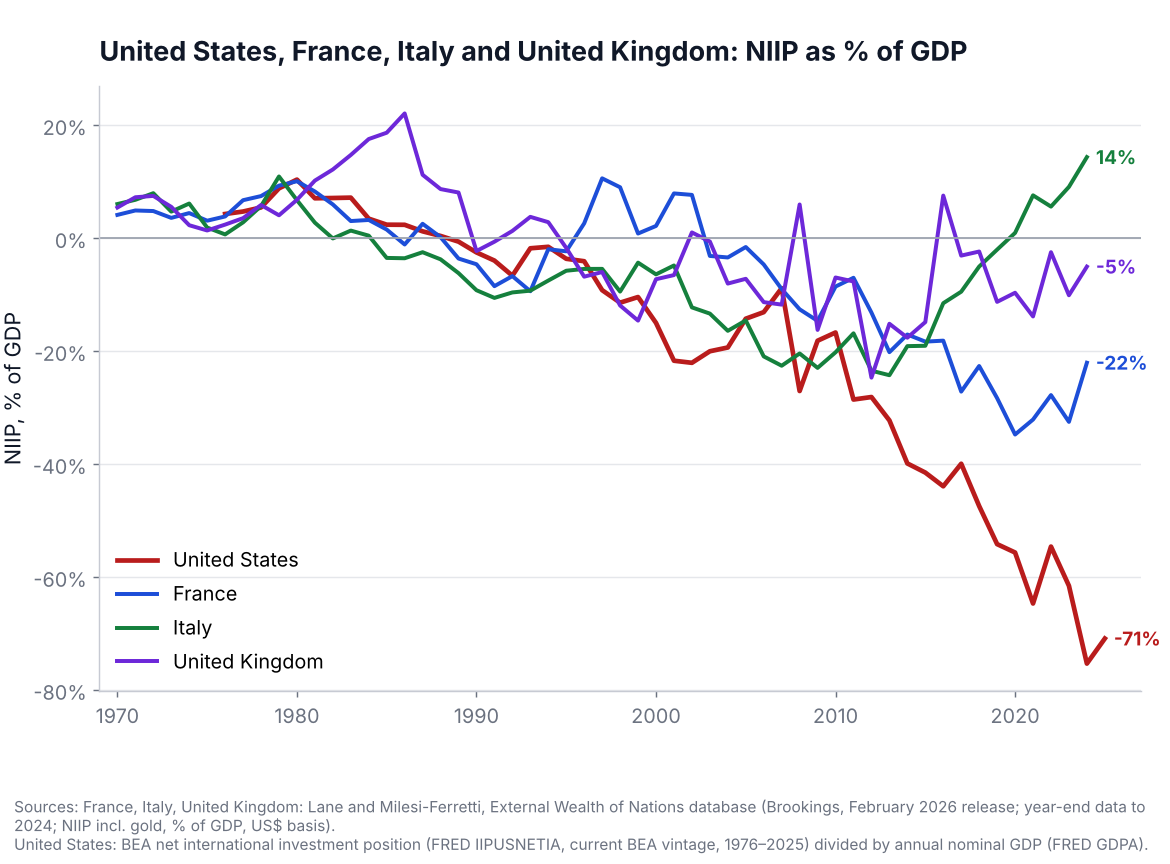
The series show different trajectories from similar starting points of 4–8% of GDP in 1970. Japan’s ratio rose from 23.3% in 2000 to 84.4% in 2024 and Germany’s from about zero in 2002 to 76.6%, while China’s peaked at 29.6% in 2008 and stood at 17.6% in 2024. The United States moved from +10.4% in 1980 to −75.3% in 2024 (−70.9% in 2025 on annual GDP), with a step from −8.8% in 2007 to −27.0% in 2008 that coincided with the global financial crisis. Italy’s swing from −24.2% in 2013 to +14.4% in 2024 is the largest turnaround among the economies shown; France reached −34.8% in 2020 and −22.0% in 2024, and the United Kingdom’s ratio, which peaked at 22.1% in 1986, has fluctuated by 20 points or more within a decade.
Creditors are not equivalent and debtors are not equally vulnerable. Table 4 groups the 17 economies by the way their external balance sheet is built, because the model, not the sign of the NIIP, determines both the risk and the transmission of an adjustment.
Table 4 — Five external balance-sheet models
| Model | Economies | Origin of the net position | Main vulnerability | Main resilience |
|---|---|---|---|---|
| Reserve-currency debtor | United States | Persistent current-account deficits, foreign demand for US assets, equity-price valuation | Marginal foreign demand, fiscal supply, relative returns | Liabilities mostly in dollars; deep markets; gross foreign-currency assets |
| State-led and industrial creditors | China, Korea | Saving above investment, export surpluses, reserve accumulation | Domestic demand weakness, capital-account management, valuation swings | Large reserves; liabilities mainly direct investment or won-denominated |
| Mature creditors with institutional saving | Japan, Germany | Surpluses, corporate and pension saving, overseas direct investment | Valuation losses on foreign assets, ageing, repatriation pressure | Income from assets; diversified, mostly equity and direct investment |
| Financial centres and resource funds | Netherlands, Switzerland, Singapore, Norway | Multinational structures, pension and sovereign funds, reserves | Very large gross positions; reliance on market prices and the exchange rate | Net creditor status; strong currencies or public asset buffers |
| Euro-area and sterling mid-positions | France, Italy, Spain, United Kingdom | Fiscal and saving gaps, bank intermediation, TARGET balances, private foreign assets | Public external liabilities; bank short-term funding | Domestic-currency liabilities; private net creditors (Italy) |
| Commodity and emerging debtors | Canada, Australia, Brazil, India | Investment above saving, FDI inflows, commodity cycles | Foreign-currency debt, portfolio-flow reversals, commodity prices | Floating currencies; FDI-heavy liabilities; pension assets abroad |
The US net liability of $22.42 trillion at end-Q2 2026 corresponds to about 71.6% of GDP at end-2025 on the revised series. The second-quarter current-account deficit was $246.0 billion, or 3.0% of GDP, and net financial-account transactions were −$369.7 billion, which is the flow part of the story. The stock part is larger: assets rose $3.72 trillion and liabilities $4.87 trillion in the quarter, mostly through prices. The structure matters more than the level. Most US liabilities are in dollars while a large share of US assets is in foreign currency, so a dollar depreciation raises the dollar value of assets without raising the dollar value of liabilities; the IMF found that in 2025 positive exchange-rate valuation and nominal GDP growth more than offset net financial outflows and price losses, narrowing the ratio slightly.
The composition of the liabilities is where the June 2026 revision bites. BEA’s new method for valuing foreign direct investment lowered the market value of FDI liabilities from about $20.3 trillion to $14.5 trillion at end-2025 (Brookings), against a historical-cost position of $5.86 trillion reported by BEA for 2025, with US direct investment abroad at $7.14 trillion. A debtor whose largest liability is equity and direct investment, rather than fixed-rate debt, shares the downside with its creditors: a fall in US equity prices lowers the liabilities, and a decline in the dollar lifts the assets. The vulnerability lies elsewhere, in the fiscal and external flows that must be financed (a federal deficit of about 5.8% of GDP in our Treasury analysis), the return differential on gross positions, and the willingness of foreign investors to hold dollar duration at current term premia.
China’s $4.071 trillion net position is the product of saving above investment, export competitiveness and reserve accumulation. Of $11.786 trillion in assets, 32% are reserves ($3.744 trillion), 30% direct investment ($3.579 trillion), 21% other investment and 17% portfolio investment ($1.988 trillion, of which $1.263 trillion equities). Of $7.715 trillion in liabilities, 52% is direct investment and 30% portfolio. The IMF assesses the 2025 current-account surplus (3.8% of GDP) as larger than fundamentals and policies justify, with a staff gap of 3.0% of GDP, and links it to weak domestic demand, high precautionary saving and a prolonged housing downturn. The financial account recorded outflows of 4.0% of GDP in 2025, so the surplus is being exported as assets. Because reserves make up 92% of the net position, the renminbi’s exchange rate and the composition of reserve holdings matter more to the valuation of China’s wealth than its portfolio investments.
Korea shows the same logic with a different mechanism. Its NIIP of $886 billion (47.3% of GDP) fell in 2025 although the current-account surplus rose to 6.6% of GDP on semiconductor exports, because foreign investors’ holdings of Korean shares rose in value. About 62% of Korean foreign assets are in dollars, so a weaker won raises the aggregate value of the position, while 61.6% of liabilities are in won. The IMF projects the NIIP to rise towards 70% of GDP by 2031 if surpluses persist.
Japan’s ¥561.75 trillion rests on ¥1,805.6 trillion of assets (21% direct investment, 43% portfolio, 21% other investment and 12% reserves) and ¥1,243.9 trillion of liabilities. In the IMF’s decomposition, portfolio assets are about 60% dollar-denominated and 18% yen. The net position generates a net investment-income return of about 7.6% in 2025, and primary income of 6.3% of GDP is what keeps the current account in surplus (4.9% of GDP) even as the goods balance is near zero. This is the opposite of the United States: Japan is paid on its net claims, whereas the United States has historically earned more on its assets than it paid on its liabilities. Japan’s public debt (above 200% of GDP) is owed mainly to residents and is not part of the NIIP calculation. Vulnerability is valuation: a sharp yen appreciation lowers the yen value of foreign assets, while a rally in Japanese equities raises liabilities, as in 2025, when liabilities rose 10.5% against assets 8.5%.
Germany’s €3,661 billion (81% of GDP) combines net direct investment of €873 billion, a net portfolio position of €999 billion, a net other-investment position of €1,235 billion and Bundesbank reserve assets of €482 billion; the Bundesbank’s TARGET claims on the Eurosystem were about €1.0 trillion at end-2025. The current account has narrowed from 8.1% of GDP on average in 2017–19 to 4.5% in 2025 as goods exports fell and consumption recovered; the IMF still assesses the external position as stronger than fundamentals and expects defence and infrastructure spending to lower the surplus. Part of the German creditor position is therefore a claim on the Eurosystem and not a market asset, and its future depends on the euro-area monetary architecture as much as on German trade. The accumulated wealth can be turned into domestic investment only through a lower saving surplus, which is what the 2027 federal budget, with about €203.6 billion of new borrowing, implies.
The Netherlands, Switzerland, Singapore and Norway have large positions of different kinds. The Dutch position (assets €10,374 billion, liabilities €9,806 billion and a net position of €568 billion at Q3 2025, De Nederlandsche Bank) reflects multinational holding structures and pension funds, and the net figure is a small difference between very large gross stocks. Switzerland’s CHF 966 billion at end-2025 (assets CHF 5,341 billion, liabilities CHF 4,375 billion) is dominated by currency reserves and direct investment abroad, and its franc valuation is exposed to a strong franc: in Q2 2025 an exchange-rate loss of CHF 263 billion on assets was largely offset by a CHF 112 billion loss on liabilities and by price gains. Singapore’s S$1,389 billion (assets S$8,830 billion) rests on portfolio assets, reserves (S$551 billion in Q2 2026) and a goods surplus of 29.2% of GDP. Norway’s NOK 21,279 billion is largely the Government Pension Fund Global (NOK 21,268 billion), a sovereign fund whose value moves with global equity prices and the krone, so Norway’s net wealth has doubled since early 2022 mostly through valuation.
France’s NIIP was −€885.4 billion, or −29.6% of GDP, at end-2025 (Banque de France; −28.4% on the IMF basis), after −€704.0 billion a year earlier, with gross assets of 384% and liabilities of 412% of GDP on the IMF basis; external debt is about 241% of GDP, of which 56% is owed by banks and 30% by the public sector (public external debt about 55% of GDP), and it is mostly in euro. The current account is near balance (−€11.6 billion, or −0.3% of GDP), so the French position is stable but carries a composition risk: large public refinancing and banks’ short-term external funding. Spain’s −€755.3 billion (−44.8% of GDP) falls to −36.7% excluding the Bank of Spain, whose TARGET position is −8.1% of GDP; gross external debt is 163.6% of GDP and the economy has a net lending capacity of 4.0% of GDP, so the NIIP is being reduced by saving, not by valuation. Italy is the contrast: a positive NIIP of €348 billion (15.4% of GDP) at end-2025 and €335 billion (14.6%) at end-June 2026 (Banca d’Italia), public-sector external liabilities of about 66% of GDP (70% long-term), TARGET liabilities down from 34% of GDP in 2022 to 16%, and a private sector that is a net creditor mainly exposed to equity risk. A debt ratio of 139.9% and a creditor position coexist because they sit on different sides of the sector accounts.
The United Kingdom’s Pink Book shows a net liability of £60.7 billion (2.0% of GDP) at end-2025, after a financial-account net inflow of £85.6 billion and a current-account deficit of £91.6 billion. Gross positions are about £15 trillion each way, so a 1% move in asset prices is about £150 billion, more than twice the net position. Direct-investment net liabilities fell from £271.4 billion to £114.7 billion in 2025, and foreign investors turned net purchasers of UK equities (£34.7 billion, after £5.7 billion of net sales in 2024). The UK shows most clearly why the net position is a poor summary and why the vintage matters.
The distinction between external liabilities that finance productive capacity and liabilities that finance absorption is best seen here. Brazil’s NIIP of −49.4% of GDP is financed about 70% by foreign direct investment, and external debt is 35.9% of GDP with reserves of $359 billion, a structure the IMF regards as sustainable, though the 2025 deterioration of 11 points came from FDI inflows and currency appreciation. Australia’s net liability of A$638.5 billion at end-2025 and A$638.9 billion at end-June 2026 (ABS), or −22.4% of GDP on the IMF basis (from an average of −58% in 2015–19), is sustainable on the IMF’s assessment because 57% of debt liabilities are in Australian dollars, assets are mainly in foreign currency and compulsory pension assets abroad give a positive net foreign-currency position, so a depreciation strengthens the balance sheet. Canada’s net foreign asset position of C$1.95 trillion at end-Q2 2026 (Statistics Canada), or 55.5% of GDP on the IMF 2025 basis (64.8% in 2024), benefits from assets with a higher foreign-currency share than liabilities, but gross external debt is 147.8% of GDP with 38% due in the short term. India’s −6.7% is small and mostly debt and inward direct investment; reserves of $691 billion cover 224% of short-term debt, and its vulnerability is commodity prices and portfolio outflows rather than the net position. By contrast, the US and, to a lesser extent, Spain carry liabilities that fund consumption and fiscal deficits.
Table 5 collects the cases where an official source reports, or allows us to derive, how much of a recent change in a NIIP came from transactions and how much from valuation and other changes. The pattern is consistent: in most of the cases the valuation term is as large as, or larger than, the flow, and in two of them the current account and the NIIP moved in opposite directions.
Table 5 — Transactions versus valuation in recent official data
| Economy and period | Change in NIIP | Transactions | Valuation and other | Note |
|---|---|---|---|---|
| United States, Q2 2026 | −$1.15 tn | −$0.37 tn | About −$0.78 tn (derived) | Liabilities +$4.87 tn, assets +$3.72 tn |
| Euro area, Q4 2025 | +€0.17 tn | +€78 bn | Prices +€136 bn; exchange rates −€35 bn; other −€13 bn | ECB split reported directly |
| Norway, Q1 2025 | −NOK 1,225 bn | +NOK 460 bn (net lending) | About −NOK 1,685 bn (derived) | Krone strengthened; global markets fell |
| Norway, Q3 2025 | +NOK 887 bn | +NOK 163 bn | About +NOK 720 bn | Market gains partly offset by stronger krone |
| Switzerland, Q2 2025 | +CHF 9 bn | — | Assets: FX −CHF 263 bn plus price gains; liabilities: FX −CHF 112 bn plus price losses | Assets −CHF 145 bn, liabilities −CHF 154 bn |
| Germany, 2025 | +€212 bn | — | Valuation gains on portfolio assets (IMF); Q1 2026 +€174.5 bn mainly valuation (Bundesbank) | Current account 4.5% of GDP |
| Japan, 2025 | +4.4% (about ¥24 tn) | — | Yen depreciation and net FDI outflows raised assets; Nikkei +26% raised liabilities | Assets +8.5%, liabilities +10.5% |
| China, 2025 | +$775 bn | — | Reserves +about $290 bn, mostly valuation (IMF) | Current account 3.8% of GDP |
| Korea, 2025 | Fell to $886 bn | Current account +6.6% of GDP | Negative: higher Korean equity prices lifted liabilities (IMF) | Surplus did not prevent a fall |
| United Kingdom, end-2025 | Data revision | — | −£199.8 bn, then −£105.6 bn, then −£60.7 bn | Vintage effect, not economics |
Four mechanisms run through the table. The exchange rate re-measures the domestic-currency value of foreign-currency assets: a weaker yen or won raises measured creditor wealth, a stronger krone or franc lowers it. Equity prices act on both sides of the balance sheet, so relative performance matters: when US equities outperform foreign equities, foreign holdings of US shares appreciate more than US holdings of foreign shares and the US net liability widens, which is the mirror image of Korea and Japan in 2025, where domestic stocks rallied. Bond prices change the market value of fixed-rate claims and liabilities with their duration, and the net effect depends on which side holds the longer duration. Finally, direct investment positions are valued by model and survey, which is why a methodological revision can move a NIIP by trillions without a transaction.
This connects the NIIP to the repricing of long-duration assets in our earlier research. A rise in global yields lowers the value of bonds on both sides of every balance sheet; the countries with the longest-duration assets and the shortest-duration liabilities lose, and those with the opposite structure gain. A relative sell-off of US risk assets, such as the 4.4% fall in the S&P 500 on 5 November 2026, would lower US external liabilities faster than assets and improve the measured US NIIP in the next quarterly release, due on 18 December, while it would worsen the positions of creditors holding US equities. We make no forecast of that number. The point is that the balance sheet records the market’s relative prices, so asset-price corrections are also the main route through which external imbalances adjust without any change in trade.
Adjustment can run through flows (saving, investment, trade) or through stocks (prices, exchange rates, returns), and the two can reinforce each other or offset. Seven mechanisms are examined, each with its transmission.
The fundamental route is a change in the saving–investment balance. For deficit economies it means higher public or private saving, which in the US case runs through a federal deficit of about 5.8% of GDP; for surplus economies, lower saving or higher investment and consumption. The IMF stresses that the adjustment has to be two-sided: a correction by debtors alone lowers external borrowing but weakens global demand if creditors do not raise domestic absorption. The evidence of movement is mixed. Germany’s surplus has fallen from 8.1% of GDP (2017–19 average) to 4.5%, and the IMF expects fiscal easing to lower it further; China’s surplus rose to 3.8% of GDP with a staff gap of 3.0%, and Korea’s to 6.6% on semiconductors; the US second-quarter deficit was 3.0% of GDP. A flow adjustment changes the NIIP only slowly: a deficit of 3% of GDP adds to the net liability by about 3% of GDP a year, before valuation.
A currency move changes the domestic-currency value of foreign-currency claims at once, and trade volumes only with a lag. For a country with foreign-currency assets and domestic-currency liabilities, depreciation improves the NIIP. Table 5a gives a hypothetical sensitivity for the United States under explicit assumptions: a fixed share of the $46.97 trillion of external assets at end-Q2 2026 is denominated in foreign currencies, all external liabilities are in dollars, and no second-round effects occur. These are assumptions, not estimates; the headline BEA release does not report the currency composition. With two-thirds of assets in foreign currency, a 10% rise in the dollar value of that basket (a dollar depreciation of about 9% against it) raises measured assets by about $3.1 trillion (0.667 × $46.97 trillion × 10%), moving the NIIP from −$22.42 trillion to about −$19.3 trillion, or about 10 percentage points of 2025 GDP of $30.9 trillion. If part of US liabilities were in foreign currencies, the gain would be smaller. The same logic produces the opposite sign for Japan and Switzerland on an appreciation.
Table 5a — Illustrative sensitivity of the US NIIP to a dollar depreciation (hypothetical)
| Foreign-currency share of US external assets | Basket +5% | Basket +10% | Basket +15% |
|---|---|---|---|
| 50% | +$1.2 tn | +$2.3 tn | +$3.5 tn |
| 66.7% (central assumption) | +$1.6 tn | +$3.1 tn | +$4.7 tn |
| 80% | +$1.9 tn | +$3.8 tn | +$5.6 tn |
The competitiveness effect works through the real exchange rate: the IMF’s staff assessments put China’s real effective exchange rate about 21% undervalued and Germany’s about 6.6% undervalued, and Canada’s and Australia’s about 11% and 17% overvalued. These are model-based assessments and carry wide ranges.
Relative equity performance redistributes net external wealth without any financial transaction. If US equities fall relative to foreign equities, US liabilities fall faster than US-owned foreign assets and the US NIIP improves, while creditors holding US shares lose; if European and Japanese shares outperform, creditor positions rise in local currency. The effect is large because foreign investors hold a large share of US equities and of US direct-investment liabilities. It is also self-limiting: an adjustment through asset prices lowers the claims of the creditors that the adjustment is meant to rebalance, which is one reason why adjustment by prices does not by itself restore balance.
Higher yields lower the market value of fixed-rate bonds on both sides of the balance sheet, and the net effect depends on duration. They also change who is willing to hold the bonds. On 6 November the US ten-year yield was about 4.86% and the 30-year 5.26%, against a Bund at 3.25%, a French OAT at about 4.75%, an Italian BTP at about 4.35%, a UK gilt near 5.15% and a JGB near 2.81%. A debtor that needs foreign buyers for its duration must offer a higher term premium if the marginal foreign buyer retreats; a creditor whose domestic yields rise faces a higher opportunity cost of holding foreign bonds. This is the link to our work on the price of public capital: external imbalances matter for bond markets because the marginal buyer of duration is often foreign.
The income on the net position is what makes a position sustainable. Japan’s assets earned about 7.6% in 2025, which supports primary income of 6.3% of GDP; China pays a deficit on foreign direct investment income that its non-FDI income only partly offsets; Brazil’s primary income deficit is 3.6% of GDP and Australia’s current account is held back by profit remittances on foreign direct investment. The United States has historically earned more on its foreign assets than it pays on its liabilities, which is why a large net liability has not produced a conventional income constraint. A narrowing of that return gap, through higher yields paid on liabilities or lower returns abroad, would deteriorate the external balance without any change in the NIIP, which is why the return differential is the most important variable to monitor for the debtor.
A debtor whose liabilities are in its own currency can reduce the real burden by inflation or by holding interest rates below inflation, redistributing real wealth from foreign creditors. The cost is a higher inflation-risk premium and weaker confidence in the currency; the 2026 energy shock, with inflation at 3.7% in the US and 4.0% in the euro area, is a live test of how creditors price that risk. For creditors with large foreign-currency assets, such as Japan, financial repression at home combined with a weak currency raises the yen value of their assets while eroding real incomes. The NIIP is a nominal measure, so these effects are invisible in it and appear only in real returns and exchange rates.
The most discussed channel is Japanese repatriation. Japanese portfolio assets are ¥768.7 trillion (43% of gross assets), about 60% of them in dollars and 18% in yen; the Bank of Japan has raised its policy rate to 1.25% and the ten-year JGB yield is near 2.81%, so the domestic alternative has become competitive for the first time in decades. The transmission would run through marginal demand for foreign duration, the yen and hedged returns. Three considerations limit the speed. Direct investment (¥384.5 trillion) is strategic and cannot be sold quickly. The institutions that hold the portfolio have mandates, such as GPIF’s strategic allocation of 25% to foreign bonds and 25% to foreign equities, that change slowly. And the relevant return is the currency-hedged yield, not the nominal gap; the IMF notes that portfolio flows into and out of Japan swung several times after 2022 with little net effect on the NIIP. The Ministry of Finance data show a mixed picture. In October 2026 residents bought a net ¥1.95 trillion of foreign securities (equities ¥1.46 trillion, long-term debt ¥0.46 trillion), while foreign investors bought a net ¥11.3 trillion of Japanese securities; the weekly series shows net sales of foreign long-term debt in four of the five weeks to 7 November. Reuters, citing the same Ministry data, reports net sales of foreign debt of ¥4.16 trillion in the year to October, about 0.5% of Japanese portfolio assets: a reallocation at the margin, not a repatriation. Similar analysis applies to China, whose reserves of $3.744 trillion are 92% of its net position and whose reserve composition is not public.
A positive NIIP does not imply an appreciating currency, nor a negative NIIP a depreciating one. Exchange rates respond to real interest-rate differentials, growth, risk appetite and the reserve-currency role, and the NIIP enters through the balance-sheet channel: it tells us how a currency move re-measures wealth and who is exposed to a change in investor preferences. Table 6 summarises the eight currencies.
Table 6 — Currencies and the external balance sheet
| Currency | Balance-sheet feature | Gradual correction | Disorderly correction |
|---|---|---|---|
| US dollar | NIIP −22.42 tn; liabilities mostly in dollars; foreign-currency assets | Moderate depreciation improves the NIIP through valuation; dollar role intact | Higher term premia and volatility, but safe-haven demand persisted in the 5–6 November sell-off |
| Euro | Aggregate NIIP +11% of GDP; creditors (Germany, Netherlands) and debtors (France, Spain) | Support from creditor strength, deeper markets and joint issuance | Divergence between member states; appreciation hurts exporters |
| Japanese yen | NIIP 86% of GDP; 60% of portfolio assets in dollars | Repatriation or narrower carry strengthens the yen; yen value of assets falls | Sharp yen rally: valuation loss on assets, margin and carry unwinds |
| Renminbi | NIIP 20.7% of GDP; reserves 92% of net assets; capital controls | Appreciation with stronger domestic demand; PBOC slows the rise | Weak demand and outflows can pressure the currency despite creditor status |
| Swiss franc | NIIP CHF 986 bn; reserves and direct investment abroad | Safe-haven strength lowers the franc value of assets | Appreciation with SNB intervention; valuation losses on assets partly offset by liabilities |
| Sterling | Gross positions about 490% of GDP; current-account deficit £91.6 bn | Moderate; financing by foreign direct investment and equity purchases | Sensitive to gilt demand (10-year about 5.15%) and gross flows |
| Canadian dollar | NIIP 55.5% of GDP; assets more foreign-currency than liabilities | Commodity and rate-differential driven | Weaker currency raises asset value, offsetting stress |
| Australian dollar | NIIP −22.4%; positive net foreign-currency position | Depreciation strengthens the balance sheet | Risk-off weakens the currency but the balance sheet is a stabiliser |
Two distinctions deserve emphasis. A weaker dollar is not a loss of dollar dominance: the dollar’s role rests on the depth of Treasury and collateral markets, the dollar share of invoicing and funding, and the lack of an alternative of comparable scale. A weaker dollar can coexist with unchanged dominance, and dominance can be questioned only if foreign investors demand higher compensation to hold dollar assets even while the currency is stable. And creditor status is no shield: Japan and Switzerland can lose on valuation when their currencies rise, and China can face pressure when growth disappoints. The currency composition of assets and liabilities, not the sign of the NIIP, determines the sign of the valuation effect.
Sovereign bonds. A correction that reduces foreign appetite for US duration raises the Treasury term premium; our companion analysis puts the New York Fed estimate at 0.89% in September, with the ten-year yield at 4.86%. Bunds benefit from creditor demand and scarcity but face supply from German borrowing of about €203.6 billion in 2027; OATs and BTPs are sensitive to euro-area investor allocation, with spreads of about 148 and 111 basis points to the Bund. JGBs would gain from repatriation and lose from higher domestic yields; gilts depend on gross foreign flows. The common thread is that external positions affect bonds through the marginal buyer, so the bonds with the highest foreign ownership and the weakest fiscal anchor are the most exposed.
Equities. Foreign ownership of US equities, direct investment and private assets means that a change in international portfolio preferences could weigh on US valuations, and the AI-related concentration of US indices raises the sensitivity; but domestic investors can replace foreign ones, and the earnings path matters more than ownership. Europe and Japan could attract flows from a relative reallocation, though currency appreciation would reduce the local-currency return of foreign investors in them. Chinese equities are affected mainly by domestic conditions and by capital-account management.
Credit, real estate and infrastructure. Higher sovereign yields and weaker foreign demand raise corporate funding costs and spreads, most for foreign-currency borrowers, high-yield issuers and banks reliant on wholesale external funding; France’s banks (56% of external debt) and Canada’s short-term external debt (38%) are examples of rollover exposure. Real assets are the most sensitive to the cost of capital because their cash flows are long-dated; a persistent rise in discount rates, together with lower foreign ownership, would lower valuations of property, infrastructure and renewables. Higher domestic investment in surplus economies could offset this by creating new assets and lowering the saving surplus that funds foreign purchases. This is the resilience-premium argument of our wider research: a shift from efficiency to resilience raises the demand for domestic capital and changes where savings are invested.
A negative NIIP is not a crisis in itself. The United States has sustained one for decades because of institutional credibility, deep markets, the ability to issue liabilities in its own currency, high returns on domestic assets and a broad investor base. Debtor positions become more dangerous when they combine large persistent deficits, short maturities, foreign-currency liabilities, thin reserves, weak institutions and dependence on volatile portfolio flows; this is why a similar NIIP ratio is a different risk in Brazil, where liabilities are FDI-heavy and reserves cover 121% of the IMF metric, and in a small economy with foreign-currency debt. Creditor positions are not unconditionally safe: they carry valuation risk, concentration, ageing-related decumulation (the IMF expects Japan to run assets down gradually) and the risk that political pressure forces repatriation. The test is whether the external position remains compatible with sustainable income and stable financing.
The scenarios are analytical frameworks, not forecasts, and carry no probabilities. At the cut-off the data contain elements of all three, which is why we do not rank them.
Table 7 — Scenario framework
| Dimension | 1 — Orderly rebalancing | 2 — Financial repricing and currency adjustment | 3 — Disorderly external adjustment |
|---|---|---|---|
| Assumptions | Complementary domestic adjustment: US public saving rises, China and Germany raise domestic demand and investment, trade stays open | Foreign demand for US assets becomes more price-sensitive; relative asset-price performance shifts; no loss of confidence | Persistent deficits, fiscal strain and fragmentation meet a sudden change in investor preferences |
| Economies most affected | US, China, Germany, Japan (gradual) | US, Japan, euro-area creditors | US financial markets; vulnerable debtors with foreign-currency or short-term funding |
| Currencies | Moderate dollar adjustment; yuan and euro gain modestly | Sustained dollar depreciation; yen and franc appreciate with valuation losses | Sharp dollar fall and volatility; safe-haven and funding-currency squeeze |
| Sovereign bonds | Stable term premia; Bund and JGB supported | Higher Treasury term premia; European and Japanese bonds attract flows | Disorderly rise in Treasury yields; wider spreads in weaker issuers |
| Equities | Broad stability; rotation towards domestic investment themes | US valuations more flow-sensitive; non-US equities re-rate | High volatility; synchronised declines; valuation losses for creditors |
| Transmission to financial conditions | Lower external financing needs; resilient funding | Higher discount rates for long-duration assets; currency-driven valuation shifts | Higher financing costs, bank losses, tighter credit, feedback between yields and fiscal strain |
| Confirming indicators | Deficits narrow; surpluses fall; stable dollar; steady foreign demand | Net foreign purchases of US assets fall; dollar and term premium rise; relative returns shift | Auction stress; yields and dollar move together; widening cross-currency basis |
| Invalidating indicators | Deficits widen; surpluses rise; protectionist escalation | Stable foreign demand and returns despite fiscal supply | Dollar rises with yields on safe-haven flows; orderly auctions |
Scenario 1 would reduce imbalances by flows, at the pace of changes in saving and investment. Scenario 2 is the financial reading and the one best aligned with the valuation mechanism: the US NIIP improves through prices while the current-account deficit persists, and creditors experience valuation losses in their own currencies. Scenario 3 is a combination of low-probability outcomes; it differs from the second in the dollar behaving as a source of stress rather than a refuge, which has not happened in the stresses of 2026 so far.
Table 8 — Monitoring dashboard for global external imbalances
| Indicator | Key economies | Latest verified reading | Next release or note |
|---|---|---|---|
| NIIP / GDP | All | US −71.6% (end-2025, revised); Japan 86%; Germany 81%; China 20.7%; euro area 11.0%; France −29.6%; Spain −44.8%; Italy 15.4% | BEA Q3 2026 on 18 December 2026 |
| Gross assets and liabilities | US, UK, Netherlands, Switzerland, Singapore | US $46.97 tn / $69.39 tn; Switzerland CHF 5,564 bn / 4,578 bn; Singapore S$9,438 bn / 7,861 bn | Quarterly, national statistical offices |
| Current account | US, China, Germany, Japan, Korea | US 3.0% of GDP (Q2 2026); China 3.8%; Germany 4.5%; Japan 4.9%; Korea 6.6% (2025) | IMF ESR annually; BEA quarterly |
| Primary income and returns | US, Japan, Germany | Japan primary income 6.3% of GDP; return on net assets 7.6% | Return on US assets versus liabilities |
| Reserves | China, Japan, India, Brazil, Singapore | China $3.744 tn; Japan about $1.4 tn; India $691 bn; Brazil $359 bn; Singapore S$551 bn | Monthly reserve releases |
| Currency composition | US, Japan, Korea, Australia | Japan portfolio 60% USD, 18% yen; Korea 62% of assets in USD; Australia positive net FX position | BEA currency detail, annual |
| Foreign ownership of sovereign debt | US, Japan, UK, euro area | Official foreign holdings of euro-area government debt almost €1 tn (end-2024, ECB) | TIC and other national data, monthly |
| Relative equity performance | US, Europe, Japan, China | S&P 500 −2.7% in the week to 6 November, −4.4% on 5 November | Daily |
| Yields and term premia | US, Germany, France, Italy, Japan, UK | UST 10-year 4.86%, 30-year 5.26%; Bund 3.25%; OAT about 4.75%; BTP about 4.35%; JGB about 2.81%; US ACM 0.89% (Sep); Germany 1.3 pp (NIESR, Sep) | Daily; term-premium estimates monthly or quarterly |
| External debt maturity and refinancing | Emerging debtors, France, Spain, Canada | Canada 38% of gross external debt short term; France banks 56% of external debt; Brazil 35.9% of GDP | IMF ESR annually |
| International portfolio flows | Japan, US, euro area | Japan, October 2026: residents’ net purchases of foreign securities ¥1.95 tn (equities ¥1.46 tn, long-term debt ¥0.46 tn); foreigners’ net purchases of Japanese securities ¥11.3 tn | Ministry of Finance, weekly (Thursdays) and monthly |
Four relationships carry most of the information. The US current-account deficit against the change in the NIIP separates flow from valuation. The dollar against the currency composition of US assets measures the valuation sensitivity. Japanese yields and foreign bond holdings against the yen track the repatriation channel. And China’s current account against domestic consumption shows whether the creditor position can rebalance.
The global external balance sheet is the accumulated result of decades of national choices about saving, investment, fiscal policy, industrial structure and the use of the international monetary system. The United States, China, Germany and Japan hold most of the net positions, financial centres and resource funds hold large positions on gross stocks that dwarf their economies, and the euro area holds a modest aggregate with large internal divergence. These stocks are not stable quantities: valuation changes, statistical revisions and reporting dates move them by more than a year of trade, and the headline number, taken alone, can mislead.
That makes the NIIP a map rather than a forecast. The United States can run a large net liability because it owes in its own currency and holds assets abroad in others, and because its liabilities are largely equity and direct investment that share the downside; the vulnerability is the return differential and the marginal demand for dollar duration. Japan, Germany and China hold wealth that is exposed to their own currencies and to the assets they hold, and their wealth is part of the demand that supports the price of global long-duration assets. A change in the relative prices of currencies, bonds and equities could redistribute external wealth with little change in trade, which is why the next adjustment may be financial as much as commercial. The data at the cut-off do not show such an adjustment under way: the dollar was a refuge in the sell-off of 5–6 November, Japanese residents were net buyers of foreign securities in October after net sales of foreign debt earlier in the year, and among the largest creditors only Germany’s surplus narrowed materially. Whether the balance sheets remain a stable background or become a transmission channel depends on three variables to watch: the return differential, the currency composition and the behaviour of the marginal foreign investor.
The analysis draws on official international investment position and balance-of-payments statistics published by national central banks and statistical authorities (the BEA, SAFE, the Japanese Ministry of Finance, the Deutsche Bundesbank, the ONS, Statistics Canada, the Banque de France, the National Bank of Belgium, the Banca d’Italia, the Australian Bureau of Statistics, the Swiss National Bank, Statistics Norway, SingStat, De Nederlandsche Bank, the Banco de Espana and the ECB), on the IMF External Sector Report 2026 and IMF Policy Paper 2026/006 for cross-country comparisons, and on Eurostat and Brookings for supplementary analysis. The long-run series in Figures 1 and 2 are the NIIP including monetary gold as a percentage of GDP, in US dollars, from the Brookings External Wealth of Nations database (Lane and Milesi-Ferretti, February 2026 release, data to end-2024); the United States series is the BEA net international investment position divided by annual nominal GDP, so the two definitions are not strictly identical. NIIP figures are point-in-time estimates of a stock and are revised as national authorities update their balance-of-payments and international investment position data. The United States is reported at end-Q2 2026 and most other economies at end-2025, so cross-country comparisons are not fully synchronised, and differences in reporting periods, statistical methodology, exchange-rate movements and asset-price valuation also affect comparisons across economies and over time. The NIIP is a stock measure of net external financial claims and is distinct from the current-account balance, which is a flow, and from gross external debt, which covers only debt instruments.
Market observations refer to the dates specified in the relevant sections and are not necessarily representative of subsequent market conditions. Derived figures are calculated from the published components identified in the tables. The illustrative sensitivity analysis and the scenarios are hypothetical and are not forecasts. This publication is macroeconomic research and does not constitute investment advice.
Related lucabindi.com research: From Inflation to Fiscal Credibility: Six Regimes of European Sovereign Yields and the Changing Price of Public Capital; Global Monetary Policy Update — November 6, 2026; The Return of the Bond Bear Market?; U.S. Treasury Yields Under a Simultaneous Federal Reserve and ECB Tightening Shock.
#GlobalMacro #NIIP #GlobalImbalances #ExternalWealth #BalanceOfPayments #CurrentAccount #CapitalFlows #USDollar #Euro #JapaneseYen #Renminbi #InternationalMonetarySystem #AssetPrices #GlobalFinancialCapitalism #InstitutionalMacroIntelligence
 lucabindi.com